Microsoft Power BI Proficiency: 2-Day Course in Adelaide

About this Event
Bring your team and save:
1. Groups of three or more receive a 10% discount
2. Organizations hosting an in-house session with 10+ participants enjoy a 15% discount.
About This Course
🗓 Duration: 2 Days (16 Hours)
👨🏫 Delivery: Live Instructor-Led Classroom Training
🎓 Certificate: Professional Certificate of Completion
🌐 Language: English
🏆 Credits: 16
🍽️ Refreshments: Lunch, snacks, and beverages will be provided during the session.
🎟 Early Bird Registration Available
If you would like weekend training sessions, kindly reach out to us at [email protected] for availability and scheduling.
Power BI Training for Professional Business Intelligence
In a data-driven workplace, professionals need the ability to turn business information into insights that support performance and growth.
Microsoft Power BI enables users to connect data from different sources, prepare and analyse information, and create interactive dashboards for informed decision-making.
This 2-Day Microsoft Power BI Comprehensive Training is designed to build practical capabilities across the Power BI ecosystem.
Course Overview
Participants will learn data preparation, modelling, DAX, dashboard development, advanced analytics, Power BI Service, collaboration, security, and performance optimisation.
Learning Outcomes
By the end of this course, you will be able to:
- Integrate and transform data from multiple sources
- Develop effective data models
- Build advanced DAX calculations
- Create interactive reports and dashboards
- Publish and share reports
- Collaborate through Power BI Service
- Optimise report performance
- Develop complete business intelligence solutions
Skills You Will Develop
- Power Query
- Data transformation
- Data modelling
- DAX
- Dashboard development
- Data visualisation
- Data storytelling
- Power BI Service
- Report sharing and security
- Performance optimisation
Target Audience
Designed for Business Analysts, Data Analysts, BI Developers, Reporting Analysts, Data Scientists, Project Managers, Finance Professionals, Operations Analysts, IT Professionals, Database Professionals, Decision Support Analysts, and professionals working with business data.
No prior Power BI experience is required. Basic Excel and data concepts are recommended.
Practical Approach
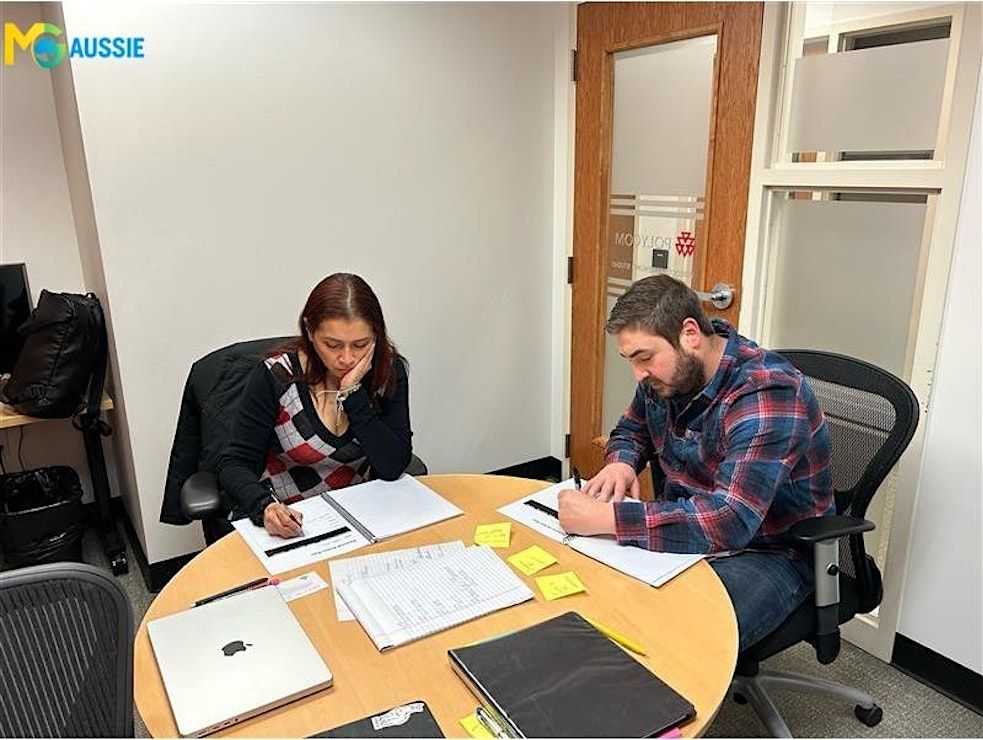
This programme uses instructor-led demonstrations, guided labs, hands-on exercises, business scenarios, collaborative discussions, and capstone projects to help participants apply Power BI skills to practical challenges.
Why Choose Us?
Our training combines expert instruction, practical application, real-world scenarios, industry best practices, and hands-on learning.
Create Better Business Intelligence
Develop the skills required to prepare data, create advanced models and calculations, design professional dashboards, optimise reports, and deliver actionable business insights.
©2026 MG Aussie Events. This content is protected by copyright law. Copy or Reproduction without permission is prohibited
Why Organizations Invest in Microsoft Power BI Training
Organizations invest in Microsoft Power BI training to help employees:
- Transform data into actionable business insights
- Improve reporting and decision-making
- Build interactive dashboards and visualizations
- Strengthen data modelling and analytics skills
- Enhance collaboration through Power BI Service
- Increase Microsoft Power BI adoption
- Support data-driven business strategies
- Develop enterprise reporting capabilities
Event Highlights
- Live Instructor-Led Training
- Comprehensive Power BI Curriculum
- Hands-On Labs & Business Scenarios
- Interactive Dashboard Development
- Advanced DAX & Data Modelling
- Power BI Service Collaboration
- End-to-End Capstone Projects
- Real-World Business Use Cases
- Professional Certificate of Completion
- Networking with BI Professionals
📧Ready to bring this powerful workshop to your team? Contact us at [email protected] to schedule your customized in-house session.

Agenda
Module 1: Introduction to Power BI Ecosystem
Info: • Understand Business Intelligence and modern analytics.
• Explore the Power BI ecosystem and architecture.
• Learn the Power BI workflow and key components.
• Compare licensing options and deployment models.
• Discover real-world business applications.
• Get started with Power BI Desktop.
• Hands-On Lab
Module 2: Power BI Architecture and Connectivity
Info: • Understand Power BI connectivity options.
• Compare Import, DirectQuery, Live, and Composite Models.
• Choose the right connectivity mode.
• Learn data refresh and gateway concepts.
• Configure efficient data connections.
• Apply connectivity best practices.
• Hands-On Lab
Module 3: Data Preparation with Power Query
Info: • Explore the Power Query interface and ETL process.
• Profile, cleanse, and transform business data.
• Apply column transformations and custom calculations.
• Merge, append, pivot, and unpivot datasets.
• Create reusable queries with M Language.
• Prepare analysis-ready datasets.
• Hands-On Lab
Module 4: Data Modelling Fundamentals
Info: • Understand core data modelling concepts.
• Build fact and dimension tables.
• Create relationships and configure cardinality.
• Apply Star Schema best practices.
• Optimize models for performance.
• Design scalable data models.
• Hands-On Lab
Module 5: DAX Fundamentals
Info: • Understand DAX fundamentals and syntax.
• Create measures and calculated columns.
• Build business KPIs and calculations.
• Apply aggregation and iterator functions.
• Follow DAX best practices.
• Create reusable business measures.
• Hands-On Lab
Module 6: Report Development & Visualization
Info: • Design effective dashboards and reports.
• Select appropriate visuals for business data.
• Create charts, tables, maps, and KPI visuals.
• Apply filters, slicers, and drill-through.
• Customize reports with themes and formatting.
• Build professional dashboards.
• Hands-On Lab
Module 7: Advanced Visualization Features
Info: • Build interactive reports with bookmarks and navigation.
• Configure buttons and report actions.
• Create dynamic reports using Q&A.
• Apply storytelling and visual design techniques.
• Improve report interactivity and usability.
• Design executive-ready dashboards.
• Hands-On Lab
Module 8: Power BI Service & Collaboration
Info: • Explore Microsoft Power BI Service.
• Publish and manage reports and workspaces.
• Share dashboards and collaborate securely.
• Understand Row-Level Security (RLS).
• Apply collaboration best practices.
• Manage enterprise reporting content.
• Hands-On Lab
Module 9 Day 1 Capstone
Info: • Apply the complete Power BI workflow.
• Prepare, model, and analyze business data.
• Create DAX measures and dashboards.
• Publish reports and share insights.
• Validate business reporting solutions.
• Review Day 1 best practices.
• Hands-On Lab
Day 2: Mastering DAX and Data Modelling
Module 10: Advanced Dimensional Modelling
Info: • Compare Star and Snowflake schema designs.
• Design optimized fact and dimension tables.
• Understand surrogate keys and dimension types.
• Apply scalable modelling techniques.
• Optimize models for enterprise reporting.
• Follow advanced modelling best practices.
• Hands-On Lab
Module 11: Relationship Scenarios
Info: • Review Power BI relationship concepts.
• Configure relationship types and filter propagation.
• Build bridge tables for complex models.
• Resolve ambiguous relationships.
• Apply relationship design best practices.
• Improve model accuracy and performance.
• Hands-On Lab
Module 12: Slowly Changing Dimensions
Info: • Understand Slowly Changing Dimension (SCD) concepts.
• Compare SCD Type 1, Type 2, and Type 3.
• Track historical business data effectively.
• Design and implement SCD solutions.
• Support accurate historical reporting.
• Apply SCD best practices.
• Hands-On Lab
Module 13: DAX Evaluation Context
Info: • Understand the DAX evaluation engine.
• Differentiate row and filter context.
• Explore context transition concepts.
• Analyze context interaction scenarios.
• Avoid common DAX mistakes.
• Improve calculation accuracy.
• Hands-On Lab
Module 14: Advanced DAX Functions
Info: • Apply advanced DAX functions and expressions.
• Use variables and nested calculations.
• Work with logical, text, and date functions.
• Build ranking and mathematical calculations.
• Optimize DAX for readability and performance.
• Follow advanced DAX best practices.
• Hands-On Lab
Module 15: Deep Dive into CALCULATE
Info: • Understand the importance of CALCULATE.
• Modify filter context effectively.
• Apply ALL, ALLEXCEPT, and REMOVEFILTERS.
• Use advanced filter techniques.
• Solve complex business calculations.
• Optimize CALCULATE expressions.
• Hands-On Lab
Module 16: DAX Time Intelligence
Info: • Build time-based business calculations.
• Create YTD, QTD, and MTD measures.
• Analyze previous and rolling periods.
• Perform growth and trend analysis.
• Configure date tables correctly.
• Apply time intelligence best practices.
• Hands-On Lab
Module 17: DAX Table Functions
Info: • Understand core DAX table functions.
• Build virtual and summary tables.
• Apply FILTER, VALUES, and ALL functions.
• Create calculated tables with DAX.
• Optimize table functions for reporting.
• Follow table modelling best practices.
• Hands-On Lab
Module 18: Querying Data Using DAX
Info: • Learn DAX query fundamentals.
• Write queries using EVALUATE and DEFINE.
• Analyze data with ORDER BY and TOPN.
• Improve query performance using DAX Studio.
• Optimize DAX queries for reporting.
• Apply query best practices.
• Hands-On Lab
Module 19: Final Capstone Project
Info: • Develop a complete Power BI solution.
• Prepare, model, and analyze business data.
• Create advanced DAX calculations.
• Build and optimize interactive dashboards.
• Present insights and recommendations.
• Validate the complete solution.
• Hands-On Lab
Module 20: Course Closure
Info: • Review key concepts and best practices.
• Identify common Power BI pitfalls.
• Explore next learning pathways.
• Receive certification guidance.
• Clarify questions with the instructor.
• Plan continued Power BI development.
• Hands-On Lab
Hands-On Practical Exercises
Info: Throughout this 2-day training, you'll complete practical labs and business scenarios designed to strengthen your Power BI development, data modelling, DAX, and dashboard-building skills.
Examples include:
• Exploring the Power BI Desktop environment
• Connecting and integrating multiple data sources
• Cleansing and transforming data with Power Query
• Building optimized data models and relationships
• Creating DAX measures and business KPIs
• Designing interactive reports and dashboards
• Publishing and sharing reports using Power BI Service
• Developing advanced DAX calculations and time intelligence measures
• Writing DAX queries and optimizing report performance
• Building an end-to-end Power BI business intelligence solution
Where is it happening?
Event Location & Nearby Stays:
AUD 900.27 to AUD 1217.93